AFP 2021 Reporting Dashboard
Setting up Your Dashboard
You will receive log-in credentials in October to access your unique dashboard. Only the primary contact we have on file will receive the link.
Navigating Your Dashboard
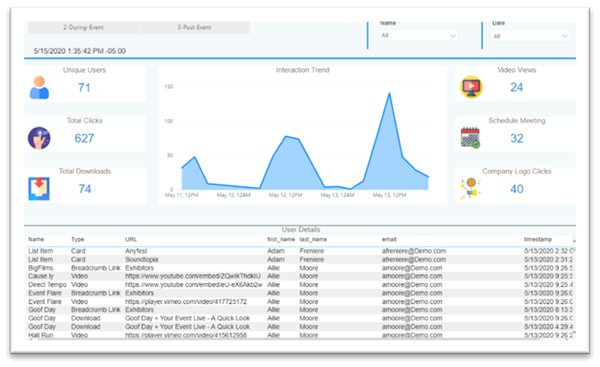
Once you’ve logged in, you will see the ‘My Event’ window listing a single event. Click on the Event to see the Exhibitors Detail view. This view will display all actions taken by attendees within your virtual booth.
You can toggle between the buttons to view During-Event or Post-Event data by using the buttons on the top left side.
Filters for all charts are displayed at the top on the right side, the charts are then displayed and at the bottom of the page is an attendee interaction breakdown chart.
Filters
There are two filters available:
- 'Name' will list your company
- ‘Date’ will list all dates based on Pre-Event/During-Event/Post-Event button selection
- To select a specific date, use the Date filter
- It is possible to choose multiple selections by using CTL (windows) or Command (MAC)
Each chart also has a set of base filters which are always in place. You can see this by hovering over the chart and clicking the filter button:
Metrics
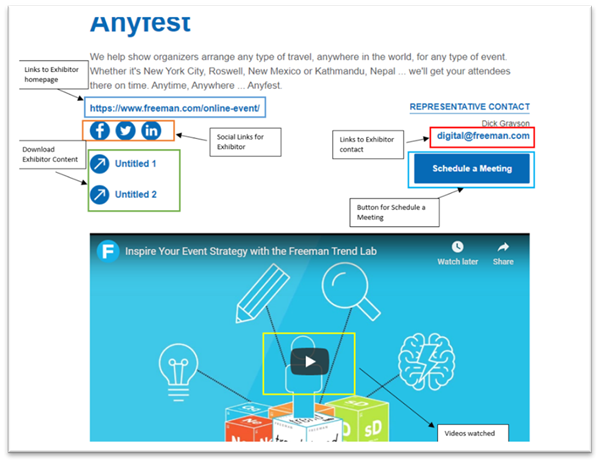
Metrics are gathered based on the clicks made on the Sponsors Profile page components. These metrics can include:
- Total unique visitor
- Total Clicks on the virtual booth
- Card - Attendee visited the virtual booth
- Company Logo - Attendee clicked on the logo image on their specific page or the link to the main website URL
- Download - Attendee clicked on content link URL
- Representative Contact - Attendee clicked on contact listed on the page
- Social Icon - Attendee clicked on a social media icon on the page
A detailed grid is provided, which shows attendee demographic information (e.g. first/last name, email address, company, etc.) for all attendees who clicked with the Exhibitor Profile page components and have not opted out of sharing information. An Exhibitor breakdown chart which displays in graphical form the various components (buttons, links, social icon, etc.) which were clicked is at the bottom of the display.
At the top of your dashboard is a cumulative amount of data showing total views, profile visits, PDF downloads, etc. You might see a discrepancy in the numbers in the contact information section. As an example, you might see at the top of your dashboard that there have been 100 individuals who have visited your profile, but when you pull contact information only 95 individuals are listed. This is because attendees have the choice to opt out of sharing their information.


